Creating a data-driven health organisation across Milton Keynes
Between 2018 and 2023, Milton Keynes University Hospital NHS Trust gained a large set of clinical data. On its journey with Oracle Health, the trust has transformed into a data-driven organisation, improving patient experience, lowering the cost of care, enhancing the staff experience, improving population health, and addressing health equity.
What’s the background and context?
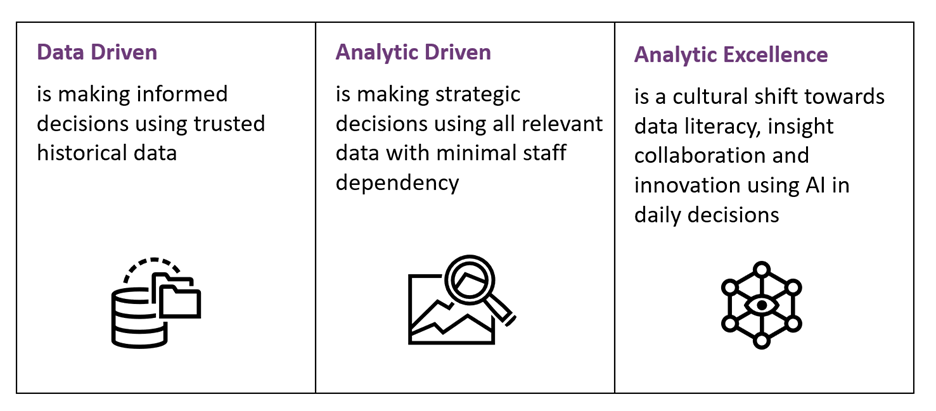
Over the past few years, Milton Keynes University Hospital NHS Foundation Trust (MKUH) has been on a clinical digital systems journey. Due to the recent advances in the organisation’s Oracle Health (formerly Cerner) electronic patient record (EPR) system between 2018 and 2023, they have gained a large set of clinical data. This has enabled MKUH to make strides in visualising and using information to support the Quintuple Aim, which includes improving patient experience, lowering the cost of care, enhancing the staff experience, improving population health, and addressing health equity. MKUH continues to advance in this field, with its goal being to evolve from a data-driven organisation today to analytic excellence in the future.
Using data to drive EPR adoption and help improve patient outcomes
MKUH had historically hoarded data and used information for outputs including statutory and ad hoc reports. However, with limited resources, the Trust struggled to find the right information for the right end users. Their data workforce and skill set were designed based on needs of traditional NHS statutory reporting, so using data more directly as an enabler for improving staff experience and patient health outcomes was an alien concept.
There was a gap between teams that needed to manage the data and format it in a way that made it meaningful and useful to those making clinical or operational decisions. The way MKUH accessed the data was down to the end users using the system and understanding the workflows. In the initial stages, once data had been clinically validated, the team could create dashboards for a small subset of users.
A dawn happened when Cerner Millennium was connected directly to the Trust’s PowerBI instance, a Microsoft product that allows users to pull in data and information to produce dashboards and visualise data in a way that’s meaningful and insightful to the end users. As PowerBI is used across the Trust for a multitude of purposes, including this data within the same platform enabled a more seamless user experience. Creating dashboards of rich data is academic if they are unusable.
Ways data is being used to drive the organisation
The very first project to use data differently analysed the way MKUH was receiving pathology and imaging results in Cerner Millennium, and the process of endorsing those results. This was a real technological response to an organisational need. Electronic endorsing of results was, at the time, a new concept that MKUH clinicians had variably adopted. There was often discussion about how electronic endorsing could be improved. How do we improve adoption, and how can we measure it? How do we know who is and isn’t endorsing results? How do we know we’re improving it? This became a sticking point, and the hospital didn’t know how to move forward.
Presenting the data through PowerBI enabled the team to split the data by department or lead clinicians responsible for results, allowing them to share the report with clinicians. Through PowerBI, it’s also possible to give access to the full report – with snapshots once a month – so each lead clinician or department could see how they’re doing, with a league table. After examining the data, the team decided to set a target: 80 per cent of results would be endorsed within two weeks. They then discovered the data included encounters for consultants who had previously left the organisation, which prompted MKUH to look at their leavers processes. For example, what steps must be taken when a clinician leaves?
Many results were attributed to senior nurses and midwives, which prompted the team to bring them into the fold in conversations and, if appropriate, have them endorse their own results. Occasionally, clinicians were ordering in the wrong encounter, which would then associate the wrong lead clinician with it. Having the data has shed fresh light on the process, and MKUH has discovered much more than it anticipated. It took time to organise this dataset, with completion only coming about in 2020 following the 2018 go-live. The team did several things wrong and made mistakes before they were able to share the correct data on endorsing results.
The next big phase was development work in response to the challenges presented by the COVID-19 pandemic. At its onset, MKUH was still an organisation driving the need for data, as opposed to being a data-driven organisation. The Trust was eager to see the data, which enabled it to prioritise the work. By compiling the data, the team had a new technical skill set across the department, but the real challenge was understanding the dataset – bridging the gap between understanding workflows and managing data.
The team experimented with the COVID-19 data, which provided several different visualisations. Two years into the pandemic, they were using the fifth version of the dashboard, which allowed them to view patient cohorts by postcode, interrogate cases of nosocomial infection (hospital-acquired COVID-19 infections) in patients, and look at those patients’ location histories – including their previous wards and beds, and which other patients they may have been in contact with.
Specific views of this report were also provided to Milton Keynes and Buckingham local health teams, with shared data sorted by relevant postcodes. These reports were updated daily, and team feedback showed that the information shared was very helpful. In December 2020, MKUH was part of the first wave of COVID-19 vaccination centres and utilised the Cerner mass vaccination workflow, Microsoft booking application, and PowerBI to create twice-daily site reports. These reports flagged data quality issues, monitored progress through the vaccination centre, and provided metrics – regarding the number of patients vaccinated, how many patients were waiting, and so on.
COVID-19 was the first time the team focused on building a system that was conducive for reporting and sharing data, and the first time data drove the way the system was built.
Designing the system with data in mind
An example of designing the system with data in mind is the revaluation of free-text fields where users can add unstructured text. MKUH knew it would require time investment to make changes. For example, MKUH reviewed a midwife form used to record patient birthing preferences. Assuming the form was completed, no action was taken, nor did the data go anywhere. MKUH redesigned the form entirely, with data in mind. Answers to questions now populate the antenatal document, meaning anyone who treats patients can view, and take into consideration, their birthing preferences. The nature of the form was then changed so it was rendered into textual narrative document and easier to consume.
Currently, reporting is available to the midwives – refreshed daily to show the number of forms completed and by which midwife. The Trust then uses this data to target extra training. For instance, it’s important for the rendered note to be completed, as this document is shared with the patient through the MyCare patient portal. When reviewing the reporting, if the Trust sees more forms than completed notes it follows up with the midwives, reiterates the process, and ensures they complete the two-step process so they can create the note again.
MKUH can then report on the number of booked patients who are more than 34 weeks pregnant and have no birthing preferences noted. This highlights gaps in the process and enables the Trust to follow up with patients to ensure their information is complete at the time of delivery. Capturing this level of data also enables the Trust to gain a better understanding of the birthing preferences of the Milton Keynes population. All of this is possible because workflows were designed with these data aims in mind, rather than being an afterthought. In simple terms, the report was designed before the data-capture forms.
MKUH has started a journey with the Oracle Health Command Centre, including real-time, predictive analytics using AI. This takes a dataset from historical EPR statistics and allows the organisation to review real-time statistics with added predictions on the hospital bed state in four-, eight-, or 12-hour intervals. This was only recently implemented, so as MKUH continues to progress, the Trust will assess the predictions accuracy and then work to update the algorithms to better align with actual events.
There are also other pilots exploring how to better use data within buildings and the hospital environment. MKUH didn’t know how its wards and spaces were being used, and with upcoming building projects, there were opportunities to take a data-driven approach to hospital design and ergonomics. As there was no existing way to accurately manage this, MKUH worked with partners Haltian and their Empathic Building solution to track staff movements – with permission – and equipment around a particular ward. By starting with the question, the organisation wanted to answer, MKUH could then build a solution that captures required data and presents it in a manner that allows management to make more informed decisions about the future hospital design with patients and staff in mind.
How does the NHS culture need to change?
National datasets feed into decision-making at a regional and national scale more generally, and into commissioning more specifically. There will always be a place for this mechanism, even if it could benefit from a little pragmatic consolidation.
When a hospital is reactive to local, regional, or national targets, the effort invested in reporting against those targets is increased and improvements are generally seen in that area. There’s a clear cost versus benefit case for the invested time and effort that brings in roles from all parts of the management structure; financial incentives are a big driver for this activity.
Finding alternative ways to commission hospitals so incentives are different but just as attractive has been a more recent approach and represents a move away from pay-as-you-go. If this were done in parallel with reducing how prescriptive that commissioning activity is, providers are afforded the space and incentive to be more innovative in the ways they deliver services. Were there support on how to introduce those innovative models into hospitals – whether exemplar sites, services, or cases that used information to respond to this challenge successfully, access to models or approaches that can be applied locally, or short-term training offered by NHS centres of excellence to develop the skills to lead on such work – then there could be a culture shift. This would be contingent on local efforts bearing fruit, so end-to-end support would be needed.
The world of information governance has come so far since COVID-19 and the introduction of the EU General Data Protection Regulation (GDPR). It is important that an information governance program considers events that can impact the organisation and legal requirements, while also considering operational efficiency. The work done across OneLondon, the Wirral, the Great North Care Record, and many more demonstrates information governance is possible and doesn’t need to be restrictive.
It’s not just NHS culture that must change. Hosting data and information management functions no longer needs to be an extortionately expensive offering. However, the commercial, well-known products available to the NHS for this purpose remain at inflated costs – leaving many to keep what they have, make difficult decisions to spend money on these platforms instead of direct care, or try to use local in-house solutions or open-source options that require significant in-house expertise.
MKUH is developing a growth culture as it responds to having data available to drive organisational change. This culture change is in progress and this case study highlights some of the benefits being realised and the ideas being explored.